| Concept | Description |
|---|---|
| Why These Methods Matter | |
| From correlation to explanation | Mediation, moderation, and interaction move HR analytics beyond simple correlation |
| Three patterns named on the chart | Each chart declares whether it is mediation, moderation, or interaction |
| Assumption visibility | The assumptions each method depends on are surfaced visibly on the page |
| Constrained causal language | Causal language is reserved for designs strong enough to support it |
| Explanation over association | A page that renders these methods well lets the audience read explanation |
| Mediation | |
| Mediator carries the effect | A mediator carries the effect from the predictor to the outcome |
| Direct and indirect paths | The total effect is decomposed into direct and indirect components |
| Pre-specified mediator | The mediator is pre-specified based on theory rather than chosen after the fact |
| Bootstrap indirect-effect interval | Bootstrap-based confidence interval is the modern standard for the indirect effect |
| Proportion mediated | The proportion of the total effect that runs through the mediator |
| Mediation assumption set | Temporal ordering, no unmeasured confounding of M-Y, no reverse causation |
| Moderation | |
| Moderator changes effect strength | A moderator changes the strength of the effect of X on Y |
| Difference across groups | Effects differ across role families, groups, or units |
| Difference across conditions | Effects differ across business-unit, climate, or other conditions |
| Difference across time | Effects differ across years or cycles |
| Difference across continuous moderator levels | Effects differ at low, mean, and high levels of a continuous moderator |
| Simple-slopes plot | The most useful visual for moderation, showing slopes at three moderator levels |
| Interaction | |
| Interaction as joint determination | Interaction frames two predictors as jointly determining the outcome |
| Nonlinearity surfaced | Interaction surfaces the nonlinearity that additive thinking misses |
| Capability-and-autonomy example | High capability with low autonomy underperforms high capability with high autonomy |
| Capability-and-opportunity framing | Capability without opportunity changes what capability does |
| Training-and-support framing | Training without manager support changes what training does |
| Performance-and-rating-discipline framing | Performance evidence without rating discipline changes what evidence does |
| Visualising the Methods | |
| Pattern label on every chart | Each chart names whether it is mediation, moderation, or interaction |
| Path or slope visual | The structure of the model is rendered, not only the coefficients |
| Assumption check panel | Confounding, ordering, and linearity assumptions are surfaced visibly |
| Confidence-interval rendering | Indirect effects, slope differences, and joint effects show their uncertainty |
| Causal-claim constraint | The chart label declares the strength of causal claim the design supports |
| Reading Explanation | |
| Reading boundary conditions | Moderation lets the audience read where and when an effect holds |
| Reading mechanisms | Mediation lets the audience read how and why an effect operates |
35 Mediation, Moderation, and Interaction Analysis in HR Variables
35.1 Why These Methods Matter for HR
A correlation between an HR variable and a business outcome is the start of an analysis, not the end of one. The interesting questions are how the effect is transmitted, when it differs, and how variables combine.
The most useful HR-analytics findings rarely take the form X is correlated with Y. They take the form X influences Y through Z (mediation), X influences Y differently for one group than another (moderation), or X and W combine to influence Y in a way that neither does alone (interaction). The methods that surface these patterns — mediation, moderation, and interaction analysis — are the analytical tools that move HR analytics from describing the workforce to explaining it. They are also the tools most often misapplied, because the same regression output supports very different inferences depending on the design that produced it and the assumptions the analyst is willing to defend.
The conceptual frame for these methods has been settled since the influential treatment by Reuben M. Baron & David A. Kenny (1986). They distinguished moderators from mediators and laid out the working logic that the field has used ever since: a mediator carries an effect, a moderator changes its strength, and an interaction shows two variables combining in a way the additive model misses. The original treatment has been refined and extended; the modern standard reference for applied work is the regression-based treatment by Andrew F. Hayes (2017), which introduced the conditional-process-analysis framework that integrates mediation, moderation, and interaction within a single computational toolkit accessible to applied analysts.
The visualisation lens is what carries these methods into the executive review. A mediation chart shows the indirect path with the coefficient on each leg visible. A moderation chart shows the same effect at different levels of the moderator on a single page. An interaction chart shows the joint effect as a surface or as a small-multiples grid. The dashboard that renders these visuals correctly is the dashboard that lets the audience read explanation rather than only association — and explanation is what the analytics function ultimately exists to provide.
TipMediation versus moderation, in one paragraph
The two methods are easy to confuse because both introduce a third variable into a regression. They answer different questions and use different models. Mediation asks how X reaches Y and introduces a mediator M on the path X → M → Y. Moderation asks when or for whom the effect of X on Y holds and introduces a moderator W that enters as the interaction term X × W. Whether a third variable should be treated as a mediator or a moderator depends on the theoretical claim, not the data — the same variable can take either role in different studies, and the role is fixed before the model is fit. A single study can carry both: a moderated mediation has an indirect effect whose size depends on W (Andrew F. Hayes (2017) gives the integrated framework).
TipThe mediation-moderation-interaction contract
- Every HR-analytics finding that goes beyond simple correlation declares which of the three patterns — mediation, moderation, or interaction — the analyst is claiming, and labels the chart accordingly.
- The assumptions each method depends on are surfaced visibly. The audience can read the strength of the inference from the chart rather than from a verbal claim.
- Causal language is reserved for designs strong enough to support it. Mediation, moderation, and interaction effects estimated from observational data are reported as patterns to investigate, not as proven mechanisms.
35.2 Mediation: How Effects Are Transmitted
Mediation is the analytical question of how an effect travels. A direct claim says X influences Y. A mediated claim says X influences Y through some intermediate variable M, and the path through M is part of the explanation. Inside HR, mediated paths are everywhere. Selection method influences performance through capability fit. Engagement influences retention through perceived support. Training influences productivity through behaviour change. The mediator is the working mechanism the function can intervene on.
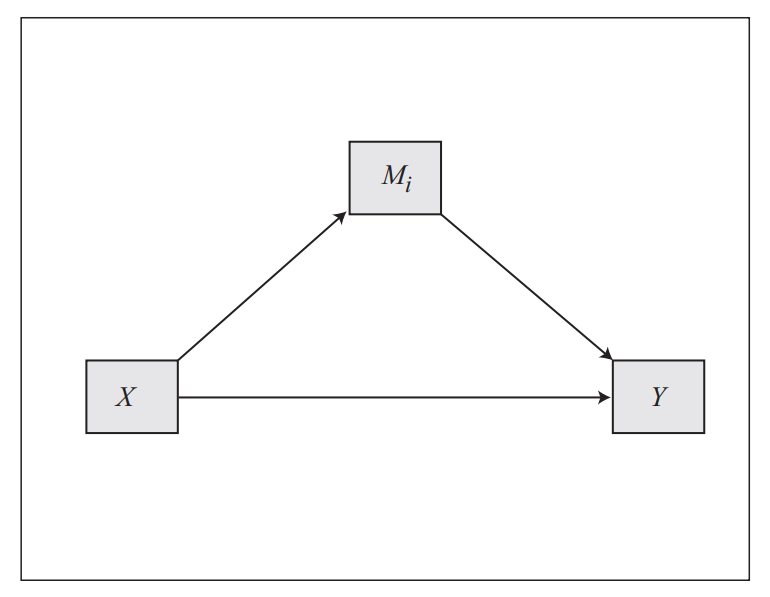
TipReading the path
The diagram captures the structure of every mediation analysis. Three regression coefficients have specific names: a from X to M, b from M to Y controlling for X, and c' from X to Y controlling for M. The total effect c is the X-to-Y coefficient before the mediator is introduced. The product-of-coefficients decomposition states the relationship cleanly:
c = c' + a × b
— the total effect equals the direct effect plus the indirect effect. The proportion of the total effect that travels through M is therefore
proportion mediated = (a × b) / c
A value near one says M carries almost all of X’s influence on Y; a value near zero says M carries little. As Reuben M. Baron & David A. Kenny (1986) set out, the original four-step screening procedure has been superseded by bootstrap-based tests of the indirect effect, but the conceptual structure rendered in the diagram remains the same: the analyst names X, M, and Y, runs the three regressions, and renders the indirect path with its confidence interval.
TipWhat disciplined mediation looks like
A disciplined mediation analysis has five properties. First, it pre-specifies M based on theory, not on what happens to mediate after the fact. Second, it acknowledges that the temporal ordering of X, M, and Y matters for the causal interpretation. Third, it bootstraps the indirect effect for robust confidence intervals. Fourth, it reports the proportion of the total effect that runs through M. Fifth, it surfaces the assumptions visibly: no unmeasured confounding of M-Y, no reverse causation.
TipThe unmeasured-confounder failure mode
The single most consequential failure mode of mediation analysis is an unmeasured variable that drives both M and Y. When such a variable exists, the b coefficient picks up the spurious M-Y correlation, the indirect-effect estimate a × b looks nonzero, and no resampling fixes the problem. Bootstrap intervals quantify sampling uncertainty, not design uncertainty. The remedy is design-side: temporal precedence in the data, instrumental variables, randomisation of M where feasible, or an explicit sensitivity analysis that asks how strong an omitted confounder would have to be to overturn the result. A mediation page that does not surface at least one of these defences is a page that will not survive an audit.
35.3 Moderation: When Effects Differ
Moderation is the analytical question of when an effect differs. A direct claim says X influences Y. A moderated claim says X influences Y more strongly under one condition than another, where the condition is captured by the moderator W. Inside HR, moderation is how boundary conditions appear in the data: the diversity-performance relationship moderated by climate; the training-productivity relationship moderated by manager support; the pay-retention relationship moderated by tenure.
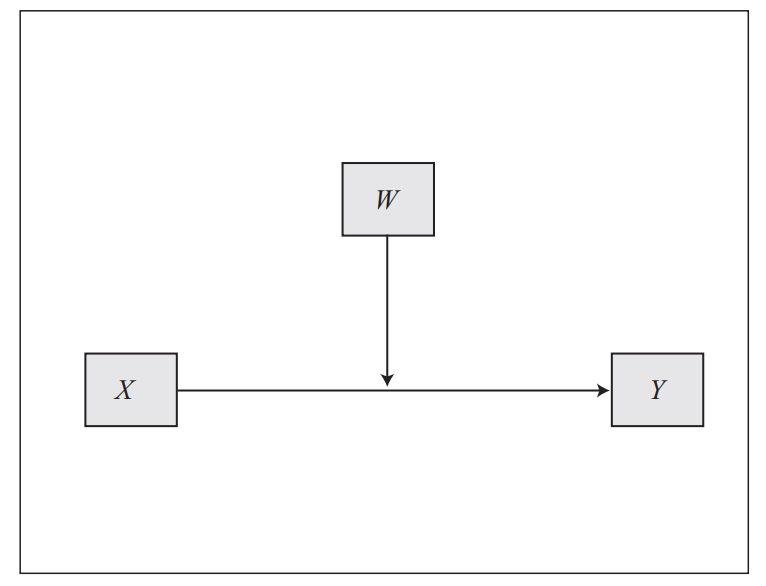
TipReading the diagram
The diagram captures three quantities. The main effect of X on Y is the direct arrow; the main effect of W is the second direct arrow; and the moderation is the influence of W on the X-Y arrow itself. In a regression equation, the same structure becomes
Y = b₀ + b₁X + b₂W + b₃(X × W) + ε
The coefficient b₃ on the product term is the moderation effect. It is the amount by which the slope of X on Y shifts per one-unit rise in W. A positive b₃ means the X-Y slope steepens as W rises; a negative b₃ means it flattens. A significant b₃ is the model’s way of saying the X-to-Y arrow is not a single arrow at all — it is an arrow whose slope depends on the value of W.
TipThe centering rule
With the interaction term in the model, b₁ and b₂ are not average slopes any more. b₁ is the slope of X when W equals zero, and b₂ is the slope of W when X equals zero. Whether zero is a meaningful value of either predictor is the question centering is meant to answer. Centring each continuous predictor on its sample mean turns b₁ and b₂ back into average slopes (slopes at the mean of the other predictor) without changing b₃. The interaction coefficient is invariant to centering; only the main effects shift. Centre when the audience needs interpretable main effects; leave uncentred when the original units carry meaning.
TipCrossover and fan interactions
The simple-slopes plot tells a richer story than a single coefficient can. Three patterns recur:
- Fan opening — slopes that diverge as the predictor rises; the moderator amplifies the X-Y relationship.
- Fan closing — slopes that converge as the predictor rises; the moderator dampens the X-Y relationship.
- Crossover — slopes that cross within the observed range of X; the direction of the X-Y effect flips across levels of W.
The hands-on exercise at the end of this chapter renders the dependence as a three-line simple-slopes plot, with one line per level of the moderator at low, mean, and high values. Reading the shape of the three lines is the visual signature of the moderation; the numerical probing in the regression confirms it.
TipWhat Moderation Surfaces
| Question moderation answers | Example | Visualisation |
|---|---|---|
| Does the effect differ across groups | Training effect across role families | Small-multiples regression by group |
| Does the effect differ across conditions | Engagement-retention link across business units | Faceted scatter with regression line |
| Does the effect differ across time | Selection-validity stability over years | Coefficient over time with confidence band |
| Does the effect differ across levels of a continuous moderator | Pay-effect moderated by tenure | Simple-slopes plot at low, mean, and high moderator |
TipThe simple-slopes visual
The most useful single visual for moderation is the simple-slopes plot. The chart shows the relationship between X and Y at three levels of the moderator W — low, mean, and high — with a regression line for each. The audience reads the moderation by reading the difference in slopes across the three lines. As Andrew F. Hayes (2017) emphasises, the simple-slopes plot collapses what could otherwise be three pages of regression output into a single chart, and the chart is what makes moderation legible to an audience that does not parse coefficients.
35.4 Interaction: How Variables Combine
Interaction is the analytical question of how two predictors combine. Mathematically, it is closely related to moderation — the regression equation includes the same product term — but the framing differs. A moderation question asks how the effect of X depends on W. An interaction question asks how X and W jointly determine Y, with neither variable necessarily privileged as the primary predictor. Inside HR, interactions are where two or more workforce levers combine: capability and motivation, autonomy and accountability, structured selection and structured onboarding.
TipWhere additive thinking fails
Interaction is the place where additive thinking fails. A workforce that is high on capability and low on autonomy will not perform at the same level as a workforce that is high on capability and high on autonomy, even if the additive model assigns the same total. The interaction chart surfaces this nonlinearity, usually as a small-multiples grid or as a contour plot. The audience reads the interaction by tracing the change in Y across the joint distribution of X and W.
TipWhen interaction is the right framing
Interaction is the right framing when the analyst’s theory says that two variables combine to produce an outcome that neither produces alone. Capability without opportunity, training without manager support, performance evidence without rating discipline — each is a place where the joint absence or presence of the second variable changes what the first does. As Andrew F. Hayes (2017) sets out, the interaction term is not different mathematically from moderation, but the framing matters for how the audience reads the chart and what action the analysis implies.
35.5 Visualising Mediation, Moderation, and Interaction
The dashboard that surfaces these three methods has to do five things at once: name the pattern, render the path or the slope, surface the assumption check, render the confidence interval, and constrain the causal claim. Five design choices, applied consistently, hold the page together for an audience that does not parse coefficients.
TipFive Design Choices for the Mediation-Moderation-Interaction Dashboard
| Choice | What it does on the page |
|---|---|
| Pattern label | Each chart names whether it is mediation, moderation, or interaction |
| Path or slope visual | The structure of the model is rendered, not only the coefficients |
| Assumption check panel | Confounding, ordering, and linearity assumptions are surfaced visibly |
| Confidence-interval rendering | Indirect effects, slope differences, and joint effects show their uncertainty |
| Causal-claim constraint | The chart label declares the strength of causal claim the design supports |
TipReading explanation rather than association
A page that renders mediation, moderation, and interaction well lets the audience read explanation rather than only association. Engagement matters becomes engagement matters more in stores with strong management support, and the path runs through reduced absence rather than directly through productivity. Diverse teams perform better becomes diverse teams perform better when climate-for-inclusion is high, and the effect is amplified for cognitively complex tasks. The richness of the explanation is what justifies the methods, and the visualisation is what makes the richness readable.
35.6 Hands-On Exercise: Running Mediation and Moderation Analyses
NoteAim, Scenario, Dataset, Deliverable
Aim. Run a mediation analysis (with a bootstrap of the indirect effect) and a moderation analysis (with a simple-slopes plot) on a real HR dataset using browser-based R (webR) and Python (Pyodide). The lab is fully self-contained inside the chapter: every step runs in the live tabs without any further tooling.
Scenario. You are testing two explanatory claims for an organisation’s leadership team. The first is that JobSatisfaction influences Attrition through the mediator WorkLifeBalance. The second is that the relationship between JobInvolvement and Attrition is moderated by YearsAtCompany — the protective effect of high job involvement on retention may depend on the employee’s organisational tenure. The lab runs entirely in the browser through the live R and Python tabs available on every page of this book; no local install is required.
Dataset. The IBM HR Analytics Employee Attrition dataset reachable as a raw CSV at raw.githubusercontent.com/yuvijen/Datasets/main/WA_Fn-UseC_-HR-Employee-Attrition.csv. The file is the original IBM-Watson sample originally released on Kaggle (www.kaggle.com/datasets/pavansubhasht/ibm-hr-analytics-attrition-dataset) and includes Age, Attrition, BusinessTravel, Department, Education, EducationField, Gender, JobInvolvement, JobSatisfaction, JobRole, MaritalStatus, MonthlyIncome, OverTime, PerformanceRating, WorkLifeBalance, YearsAtCompany, and a number of additional fields. The lab uses JobSatisfaction, WorkLifeBalance, JobInvolvement, OverTime, and Attrition.
Deliverable. A Mediation-Moderation.R script (downloaded from the webR tab) or a Mediation-Moderation.py script (downloaded from the Pyodide tab) containing the full analysis: data load, three Baron-Kenny regressions, bootstrap interval, moderation regression, and simple-slopes plot.
35.6.1 Step 1 — Load the dataset and prepare the variables
Run the snippet below in either the R or Python tab. The code reads the IBM HR Employee Attrition CSV directly from the yuvijen/Datasets repository, handles the leading byte-order mark on the first column, converts Attrition and OverTime into binary numeric form, and prints a summary so you can confirm the data loaded correctly.
35.6.2 Step 2 — Run the three Baron-Kenny regressions for mediation
Estimate the total effect (X to Y), path a (X to M), and the direct effect (X to Y controlling for M). Path b is read from the third regression as the coefficient on the mediator.
35.6.3 Step 3 — Bootstrap the indirect effect
Generate the bootstrap distribution of the indirect effect across 1,000 resamples and read the 2.5th and 97.5th percentiles as the ninety-five per cent confidence interval. The confidence interval is the headline statistic the dashboard renders for the mediation claim.
35.6.4 Step 4 — Compute the proportion mediated
35.6.5 Step 5 — Run the moderation regression
Fit a single regression of AttritionBinary on JobInvolvement, YearsAtCompany, and their interaction. The coefficient on the interaction term tests whether the JobInvolvement-Attrition relationship differs across organisational tenure.
35.6.6 Step 6 — Build the simple-slopes plot
Render the moderation as a simple-slopes plot. The Aiken-West convention pins the moderator at three values — one standard deviation below the mean, the mean, and one standard deviation above — and traces the predicted outcome across the predictor at each level. The raw observations are scattered underneath in a muted grey so the audience reads the slopes against the data they are computed from.
The simple slope at a given value of W is computed directly from the regression coefficients, without re-running predict() on a grid. For the model Y = b₀ + b₁X + b₂W + b₃(X × W), the slope of Y on X at any chosen value of W is b₁ + b₃ × W. The intercept at that same W is b₀ + b₂ × W. The two together draw the line at that level of the moderator. The code below uses this formula approach, which is faster, more transparent, and matches how applied analysts compute simple slopes by hand.
The three numbers printed above the chart are the simple slopes of JobInvolvement on AttritionBinary at each tenure level. A more negative slope means high job involvement is more strongly protective at that tenure level. Compare the three values: a fan that opens or closes tells a different story from a crossover, and the difference is the moderation finding the analysis is reporting.
For readers who want to go further, the same model supports the Johnson-Neyman region of significance: rather than probing at three cherry-picked values of YearsAtCompany, plot the conditional slope of JobInvolvement and its 95% confidence band across the whole range of tenure, then read off the values of W at which the band excludes zero. The technique requires the model’s variance-covariance matrix and a small additional computation; it is well documented in Andrew F. Hayes (2017).
35.6.7 Step 7 — Read the assumptions alongside the result
The headline numbers from Steps 2–6 (total effect, indirect-effect interval, proportion mediated, interaction coefficient, three tenure-conditional slopes) are credible only under the assumptions named in Section 2 and Section 3 of this chapter. Before stopping, write down for each result whether the assumption is plausible in your setting:
- For mediation: temporal ordering of X, M, and Y; no unmeasured confounding of M and Y; no reverse causation from Y to M.
- For moderation: linearity of the X-Y relationship within each level of W; no omitted-variable bias for either main effect.
A finding that survives this audit is one the function can defend; a finding that does not is one to investigate further before acting on.
TipConnect to the Visualisation Layer
The mediation-and-moderation analysis sits as the explanatory layer above the descriptive and predictive pages of earlier chapters. Where Chapter 24 surfaced predicted attrition risk, this chapter explains the path through which job satisfaction influences attrition and the conditions under which job involvement protects retention. The webR and Pyodide tabs on the chapter page let any reader rerun the analysis directly in the browser, without leaving the book.
TipFiles and Screen Recordings
Mediation-Moderation.R, Mediation-Moderation.py, and ch34-mediation-moderation-walkthrough.mp4 will be attached at this point in the published edition. The screen recording walks through Steps 1 to 7 with the webR and Pyodide tabs running the regressions, the bootstrap, the moderation regression, and the simple-slopes plot.